how-to-calculate-the-cpu-usage-in-linux
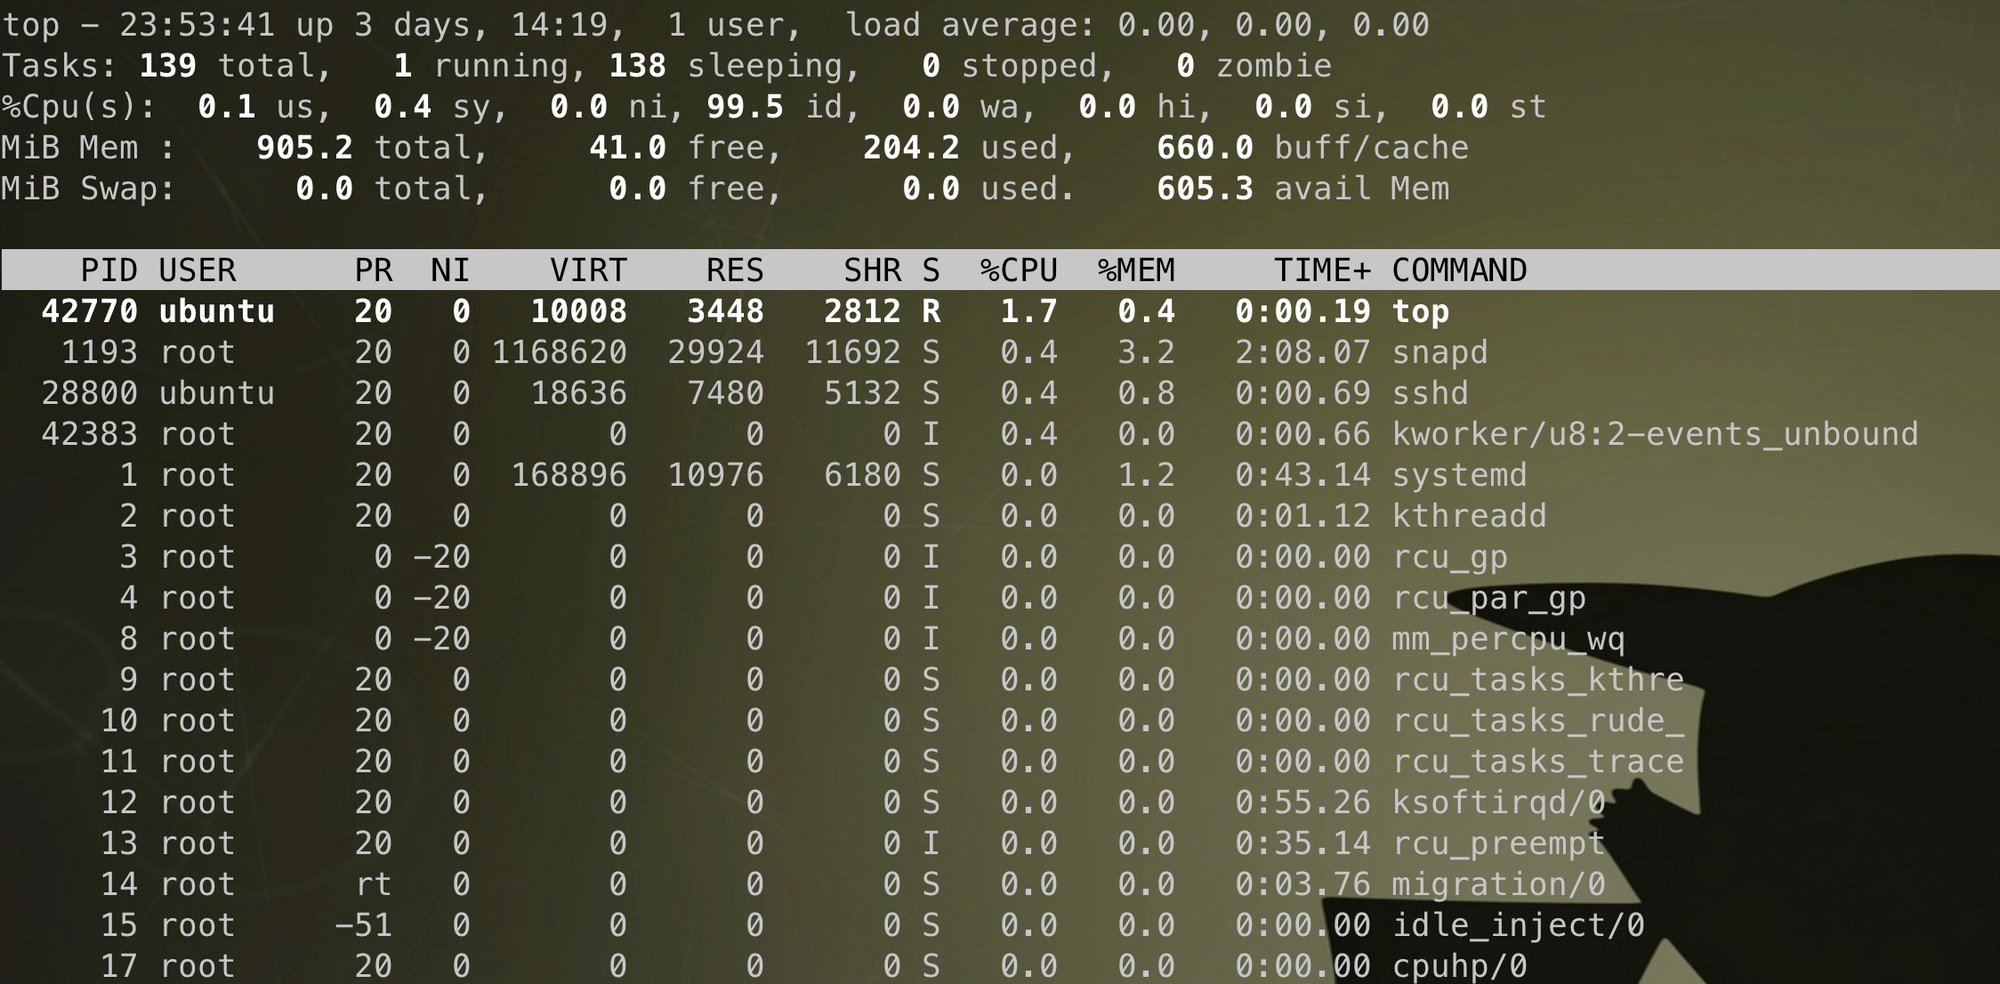
As we know, one can use top or other tools to get cpu usage。 Below is the output of top
Now I will explain how to calculate the CPU usage in Linux.
One word, the CPU usage is the percent of the time that the CPU is being used to complete tasks.
- If there is no task to run, CPU is idle;
- If CPU is doing some work, it’s busy;
- Sometime CPU is waiting for the IO operation to complete, is’s so-called iowait.
There are two kind of usage.
- usage of host, like the third line of top output above, indicating how busy is the machine.
- usage of task, like the output of
pidstat -p <pid>ortop -p <pid>, indicating how busy is the task.
This two kinds are calculated from two different methods.
CPU usage of host
The /proc/stat show the cpu time since boot, you can read man5 proc to learn the meaning of each filed.
We can use this data to calculate the cpu usage.
$ cat /proc/stat
cpu  213860 18873 343944 189330737 62970 0 31144 0 0 0
cpu0 49673 4080 80138 47314582 14867 0 8846 0 0 0
cpu1 56404 5252 91137 47337714 17009 0 7137 0 0 0
cpu2 53982 4898 86368 47347553 16491 0 6917 0 0 0
cpu3 53799 4642 86300 47330886 14601 0 8242 0 0 0
intr 3954208668 0 0 1591691 74 0 10698876 447683 0 0 0 10104090 0 0 0 0 0 0 0 0 0 0 0 0 0 0 0 0 0 0 0 0 0 0 0 0 0 0 0 0 0 0 0 0 0 0 0 0 0 0 0 0 3907847122 0 0 0 0 0 0 0 0 218 0 274327 0 0 0 0 0 0 0 0 1261 0 0 0 0 0 0 0 0 0 0 0 0 0 0 0 0 0 0 0 0 0 0 0 0 0 0 244707 4212 0 0 0 0 3852 0 0 0 0 0 0 0 0 0 0 0 0 0 0 0 0 0 0 0 0 0 0 0 0 0 0 0 0 0 0 0 0 0 0 0 0 0 0 0 0 0 0 0 0 0 0 0 0 0 0 0 0 0 0 0 0 0 0 0 0 0 0 0 0 0 0 0 0 0 0 0 0 0 0 0 22990556 0 0 0
ctxt 66538962
btime 1653442436
processes 115120
procs_running 1
procs_blocked 0
softirq 121681140 2 9751934 1197630 19644916 285353 0 76231181 11528062 4160 3037902
$ man5 proc

 /proc/stat
              kernel/system statistics.  Varies with architecture.
              Common entries include:

              cpu 10132153 290696 3084719 46828483 16683 0 25195 0
              175628 0
              cpu0 1393280 32966 572056 13343292 6130 0 17875 0 23933 0
                     The amount of time, measured in units of USER_HZ
                     (1/100ths of a second on most architectures, use
                     sysconf(_SC_CLK_TCK) to obtain the right value),
                     that the system ("cpu" line) or the specific CPU
                     ("cpuN" line) spent in various states:

                     user   (1) Time spent in user mode.

                     nice   (2) Time spent in user mode with low
                            priority (nice).

                     system (3) Time spent in system mode.

                     idle   (4) Time spent in the idle task.  This value
                            should be USER_HZ times the second entry in
                            the /proc/uptime pseudo-file.

                     iowait (since Linux 2.5.41)
                            (5) Time waiting for I/O to complete.  This
                            value is not reliable, for the following
                            reasons:

                            1. The CPU will not wait for I/O to
                               complete; iowait is the time that a task
                               is waiting for I/O to complete.  When a
                               CPU goes into idle state for outstanding
                               task I/O, another task will be scheduled
                               on this CPU.

                            2. On a multi-core CPU, the task waiting for
                               I/O to complete is not running on any
                               CPU, so the iowait of each CPU is
                               difficult to calculate.

                            3. The value in this field may decrease in
                               certain conditions.

                     irq (since Linux 2.6.0)
                            (6) Time servicing interrupts.

                     softirq (since Linux 2.6.0)
                            (7) Time servicing softirqs.

                     steal (since Linux 2.6.11)
                            (8) Stolen time, which is the time spent in
                            other operating systems when running in a
                            virtualized environment

                     guest (since Linux 2.6.24)
                            (9) Time spent running a virtual CPU for
                            guest operating systems under the control of
                            the Linux kernel.

                     guest_nice (since Linux 2.6.33)
                            (10) Time spent running a niced guest
                            (virtual CPU for guest operating systems
                            under the control of the Linux kernel).
We cat /proc/stat and store the content as stat1, sleep a while, cat-store again as stat2.
    total = (stat2.cpu.user + stat2.cpu.nice + stat2.cpu.system + stat2.cpu.idle + stat2.cpu.iowait + stat2.cpu.irq + stat2.cpu.softirq + stat2.cpu.steal + stat2.cpu.guest + stat2.cpu.guest)-
    (stat1.cpu.user + stat1.cpu.nice + stat1.cpu.system + stat1.cpu.idle + stat1.cpu.iowait + stat1.cpu.irq + stat1.cpu.softirq + stat1.cpu.steal + stat1.cpu.guest + stat1.cpu.guest)
    idle = stat2.cpu.idle - stat1.cpu.idle
    idle.percent = idle/total * 100 %
    usage = cpu.percent = 1 - idle
Usage is between 0 and 100%.
In multi process machine, we can see the cpu0, cpu1… lines, so we can get the single core usage by same method.
CPU usage of task
The /proc/<pid>/stat show the cpu time used by the task since the task was started.
For example: task pid = 1024, the path is /proc/1024/stat.
You can also read the man proc the learn the meaning of each filed.
$ cat /proc/1024/stat
1024 (java) S 1 730 730 0 -1 1077936384 1225 0 152 0 3192 11929 0 0 20 0 9 0 7098 5029285888 3554 18446744073709551615 1 1 0 0 0 0 0 0 2143420159 0 0 0 17 1 0 0 0 0 0 0 0 0 0 0 0 0 0
$ man5 proc
 /proc/[pid]/stat
              Status information about the process.  This is used by
              ps(1).  It is defined in the kernel source file
              fs/proc/array.c.

              The fields, in order, with their proper scanf(3) format
              specifiers, are listed below.  Whether or not certain of
              these fields display valid information is governed by a
              ptrace access mode PTRACE_MODE_READ_FSCREDS |
              PTRACE_MODE_NOAUDIT check (refer to ptrace(2)).  If the
              check denies access, then the field value is displayed as
              0.  The affected fields are indicated with the marking
              [PT].

              (1) pid  %d
                     The process ID.

              (2) comm  %s
                     The filename of the executable, in parentheses.
                     Strings longer than TASK_COMM_LEN (16) characters
                     (including the terminating null byte) are silently
                     truncated.  This is visible whether or not the
                     executable is swapped out.

              (3) state  %c
                     One of the following characters, indicating process
                     state:

                     R  Running

                     S  Sleeping in an interruptible wait

                     D  Waiting in uninterruptible disk sleep

                     Z  Zombie

                     T  Stopped (on a signal) or (before Linux 2.6.33)
                        trace stopped

                     t  Tracing stop (Linux 2.6.33 onward)

                     W  Paging (only before Linux 2.6.0)

                     X  Dead (from Linux 2.6.0 onward)

                     x  Dead (Linux 2.6.33 to 3.13 only)

                     K  Wakekill (Linux 2.6.33 to 3.13 only)

                     W  Waking (Linux 2.6.33 to 3.13 only)

                     P  Parked (Linux 3.9 to 3.13 only)

              (4) ppid  %d
                     The PID of the parent of this process.

              (5) pgrp  %d
                     The process group ID of the process.

              (6) session  %d
                     The session ID of the process.

              (7) tty_nr  %d
                     The controlling terminal of the process.  (The
                     minor device number is contained in the combination
                     of bits 31 to 20 and 7 to 0; the major device
                     number is in bits 15 to 8.)

              (8) tpgid  %d
                     The ID of the foreground process group of the
                     controlling terminal of the process.

              (9) flags  %u
                     The kernel flags word of the process.  For bit
                     meanings, see the PF_* defines in the Linux kernel
                     source file include/linux/sched.h.  Details depend
                     on the kernel version.

                     The format for this field was %lu before Linux 2.6.

              (10) minflt  %lu
                     The number of minor faults the process has made
                     which have not required loading a memory page from
                     disk.

              (11) cminflt  %lu
                     The number of minor faults that the process's
                     waited-for children have made.

              (12) majflt  %lu
                     The number of major faults the process has made
                     which have required loading a memory page from
                     disk.

              (13) cmajflt  %lu
                     The number of major faults that the process's
                     waited-for children have made.

              (14) utime  %lu
                     Amount of time that this process has been scheduled
                     in user mode, measured in clock ticks (divide by
                     sysconf(_SC_CLK_TCK)).  This includes guest time,
                     guest_time (time spent running a virtual CPU, see
                     below), so that applications that are not aware of
                     the guest time field do not lose that time from
                     their calculations.

              (15) stime  %lu
                     Amount of time that this process has been scheduled
                     in kernel mode, measured in clock ticks (divide by
                     sysconf(_SC_CLK_TCK)).

              (16) cutime  %ld
                     Amount of time that this process's waited-for
                     children have been scheduled in user mode, measured
                     in clock ticks (divide by sysconf(_SC_CLK_TCK)).
                     (See also times(2).)  This includes guest time,
                     cguest_time (time spent running a virtual CPU, see
                     below).

              (17) cstime  %ld
                     Amount of time that this process's waited-for
                     children have been scheduled in kernel mode,
                     measured in clock ticks (divide by
                     sysconf(_SC_CLK_TCK)).

              (18) priority  %ld
                     (Explanation for Linux 2.6) For processes running a
                     real-time scheduling policy (policy below; see
                     sched_setscheduler(2)), this is the negated
                     scheduling priority, minus one; that is, a number
                     in the range -2 to -100, corresponding to real-time
                     priorities 1 to 99.  For processes running under a
                     non-real-time scheduling policy, this is the raw
                     nice value (setpriority(2)) as represented in the
                     kernel.  The kernel stores nice values as numbers
                     in the range 0 (high) to 39 (low), corresponding to
                     the user-visible nice range of -20 to 19.

                     Before Linux 2.6, this was a scaled value based on
                     the scheduler weighting given to this process.

              (19) nice  %ld
                     The nice value (see setpriority(2)), a value in the
                     range 19 (low priority) to -20 (high priority).

              (20) num_threads  %ld
                     Number of threads in this process (since Linux
                     2.6).  Before kernel 2.6, this field was hard coded
                     to 0 as a placeholder for an earlier removed field.

              (21) itrealvalue  %ld
                     The time in jiffies before the next SIGALRM is sent
                     to the process due to an interval timer.  Since
                     kernel 2.6.17, this field is no longer maintained,
                     and is hard coded as 0.

              (22) starttime  %llu
                     The time the process started after system boot.  In
                     kernels before Linux 2.6, this value was expressed
                     in jiffies.  Since Linux 2.6, the value is
                     expressed in clock ticks (divide by
                     sysconf(_SC_CLK_TCK)).

                     The format for this field was %lu before Linux 2.6.

              (23) vsize  %lu
                     Virtual memory size in bytes.

              (24) rss  %ld
                     Resident Set Size: number of pages the process has
                     in real memory.  This is just the pages which count
                     toward text, data, or stack space.  This does not
                     include pages which have not been demand-loaded in,
                     or which are swapped out.  This value is
                     inaccurate; see /proc/[pid]/statm below.

              (25) rsslim  %lu
                     Current soft limit in bytes on the rss of the
                     process; see the description of RLIMIT_RSS in
                     getrlimit(2).

              (26) startcode  %lu  [PT]
                     The address above which program text can run.

              (27) endcode  %lu  [PT]
                     The address below which program text can run.

              (28) startstack  %lu  [PT]
                     The address of the start (i.e., bottom) of the
                     stack.

              (29) kstkesp  %lu  [PT]
                     The current value of ESP (stack pointer), as found
                     in the kernel stack page for the process.

              (30) kstkeip  %lu  [PT]
                     The current EIP (instruction pointer).

              (31) signal  %lu
                     The bitmap of pending signals, displayed as a
                     decimal number.  Obsolete, because it does not
                     provide information on real-time signals; use
                     /proc/[pid]/status instead.

              (32) blocked  %lu
                     The bitmap of blocked signals, displayed as a
                     decimal number.  Obsolete, because it does not
                     provide information on real-time signals; use
                     /proc/[pid]/status instead.

              (33) sigignore  %lu
                     The bitmap of ignored signals, displayed as a
                     decimal number.  Obsolete, because it does not
                     provide information on real-time signals; use
                     /proc/[pid]/status instead.

              (34) sigcatch  %lu
                     The bitmap of caught signals, displayed as a
                     decimal number.  Obsolete, because it does not
                     provide information on real-time signals; use
                     /proc/[pid]/status instead.

              (35) wchan  %lu  [PT]
                     This is the "channel" in which the process is
                     waiting.  It is the address of a location in the
                     kernel where the process is sleeping.  The
                     corresponding symbolic name can be found in
                     /proc/[pid]/wchan.

              (36) nswap  %lu
                     Number of pages swapped (not maintained).

              (37) cnswap  %lu
                     Cumulative nswap for child processes (not
                     maintained).

              (38) exit_signal  %d  (since Linux 2.1.22)
                     Signal to be sent to parent when we die.

              (39) processor  %d  (since Linux 2.2.8)
                     CPU number last executed on.

              (40) rt_priority  %u  (since Linux 2.5.19)
                     Real-time scheduling priority, a number in the
                     range 1 to 99 for processes scheduled under a real-
                     time policy, or 0, for non-real-time processes (see
                     sched_setscheduler(2)).

              (41) policy  %u  (since Linux 2.5.19)
                     Scheduling policy (see sched_setscheduler(2)).
                     Decode using the SCHED_* constants in
                     linux/sched.h.

                     The format for this field was %lu before Linux
                     2.6.22.

              (42) delayacct_blkio_ticks  %llu  (since Linux 2.6.18)
                     Aggregated block I/O delays, measured in clock
                     ticks (centiseconds).

              (43) guest_time  %lu  (since Linux 2.6.24)
                     Guest time of the process (time spent running a
                     virtual CPU for a guest operating system), measured
                     in clock ticks (divide by sysconf(_SC_CLK_TCK)).

              (44) cguest_time  %ld  (since Linux 2.6.24)
                     Guest time of the process's children, measured in
                     clock ticks (divide by sysconf(_SC_CLK_TCK)).

              (45) start_data  %lu  (since Linux 3.3)  [PT]
                     Address above which program initialized and
                     uninitialized (BSS) data are placed.

              (46) end_data  %lu  (since Linux 3.3)  [PT]
                     Address below which program initialized and
                     uninitialized (BSS) data are placed.

              (47) start_brk  %lu  (since Linux 3.3)  [PT]
                     Address above which program heap can be expanded
                     with brk(2).

              (48) arg_start  %lu  (since Linux 3.5)  [PT]
                     Address above which program command-line arguments
                     (argv) are placed.

              (49) arg_end  %lu  (since Linux 3.5)  [PT]
                     Address below program command-line arguments (argv)
                     are placed.

              (50) env_start  %lu  (since Linux 3.5)  [PT]
                     Address above which program environment is placed.

              (51) env_end  %lu  (since Linux 3.5)  [PT]
                     Address below which program environment is placed.

              (52) exit_code  %d  (since Linux 3.5)  [PT]
                     The thread's exit status in the form reported by
                     waitpid(2).
So the cpu usage of one task is the cpu time used by the task(14 utime + 15 stime, unit is clock ticks) / the real time past (from /proc/uptime, unit is seconds).
We cat /proc/<pid>/stat and /proc/uptime, store the content as stat1 and uptime1, sleep a while, cat-store again as stat2 and uptime2.
cpu usage of task =
       ((stat2.utime+stat2.stime-stat1.utime-stat1.stime)/sysconf(_SC_CLK_TCK)) /
       (uptime2 - uptime1)
       * 100%
Usage is between 0 and (count of cpus) * 100%. If the task has multi thread and all run in different core together, than the cpu usage of task is larger than 100%. That`s different from the cpu usage of host.